
META
📊 Meta’s current EV/Free Cash Flow multiple is trading slightly below its 10-year average, though the average might be skewed by high 2022 figures.
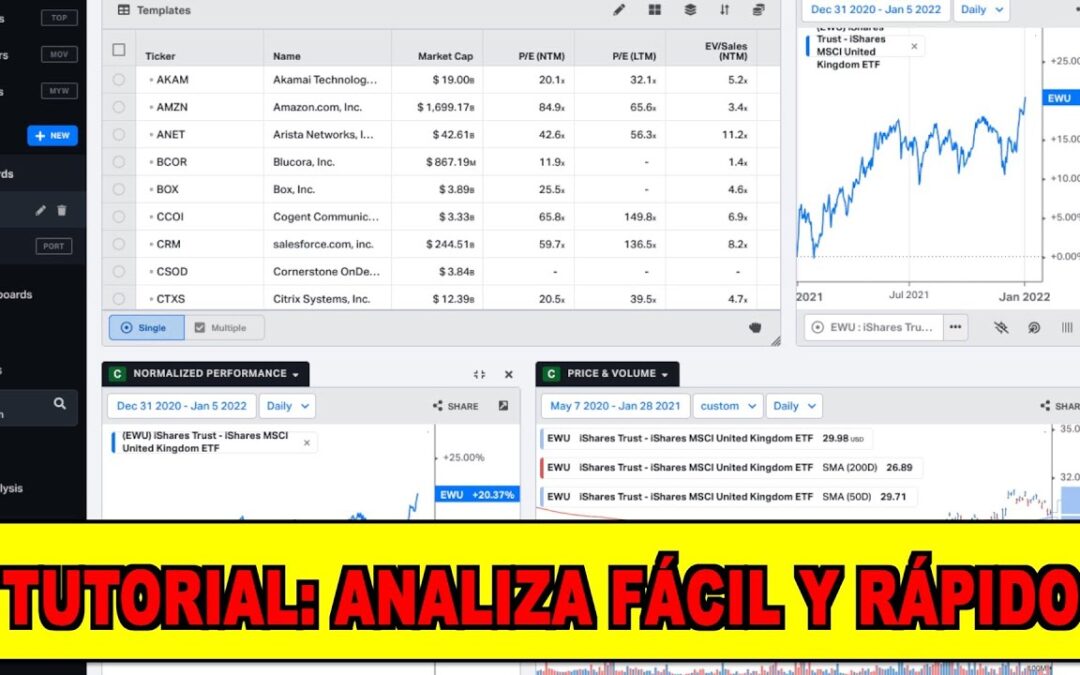
📈 The forward P/E ratio over the last 5 years averages 22, while the current ratio is 24, suggesting it’s slightly more expensive than its recent history.
💰 The company demonstrates positive trends with consistent share buybacks (reducing shares outstanding) and maintaining a net cash position, alongside good revenue and free cash flow growth.
@bernardodegarcia:
“Let’s put Meta. Forget all this; let’s close it. When you search for a company the first time, you’ll search for Meta, and it will appear. We’ll want to add metrics. Let’s add EV/EBITDA for the next 12 months. Perfect. Let’s add free cash flow. We also want to look for the P/E ratio for the next 12 months. Perfect. There it is. We’ll probably also want to look for the number of shares the company has, if it has been buying or selling shares. Shares outstanding, current. We always want to find the debt. Let’s look for net debt for the last 12 months. Fantastic. What else interests us? We want to know if there’s revenue growth. Total revenues, last 12 months. Let’s add free cash flow, last 12 months. Let’s add capex as a percentage of revenues, last 12 months. Okay, let’s organize. We have EV/FCF yield, P/E ratio, EV/EBITDA. Revenue growth, let’s change it to annual growth and use bars, green for growth, red for decline. Free cash flow, I like it in red. ROIC, let’s make it purple. We can add statistical bands like the average and standard deviations to metrics like EV/EBITDA or P/E. Let’s add the average and standard deviations to EV/Free Cash Flow. Let’s make the average solid and the bands dashed. Let’s change the color to purple. Let’s do the same for the P/E ratio, adding the average and standard deviations, making the average solid blue. Now it looks much better. Notice that Meta’s EV/Free Cash Flow is trading below the 10-year average. The average is 3.55%, currently slightly below, meaning it’s a bit more expensive, but seems around the average. Looking at the P/E ratio over the last 5 years, the average P/E was 22, and it’s currently at 24, a bit more expensive than historically. Remember, this is the forward P/E. Then we have the shares it has been buying back, fantastic, from 2.85 billion to 2.53 billion. It’s a company that buys back shares. It’s a company with net cash, although it had much more before ($52 billion vs. $28 billion now), but net cash is net cash. Revenues have grown quite well, and free cash flow has also grown well, though revenues grew more than free cash flow. And finally, the ROIC.”
Watch the exact part of the video where @bernardodegarcia talks about Meta Platforms, Inc. here:
Watch the video on YouTube
Read more articles analyzing Meta Platforms, Inc. (META) at the provided link. META stock.
