

Interactive Brokers Earnings: Growth vs Rate Headwinds
📈 Commission Revenue showed strong growth, rising 36% to $514 million, indicating robust trading activity.
📉 Net Interest Income (NII) growth slowed to 3%, with future pressure expected as interest rates potentially decline, impacting a key revenue source.
⚖️ Valuation analysis suggests the stock is trading around 22-23 times earnings, near its historical average, but a lower multiple (around 17-18x) might be more attractive given the NII headwinds.
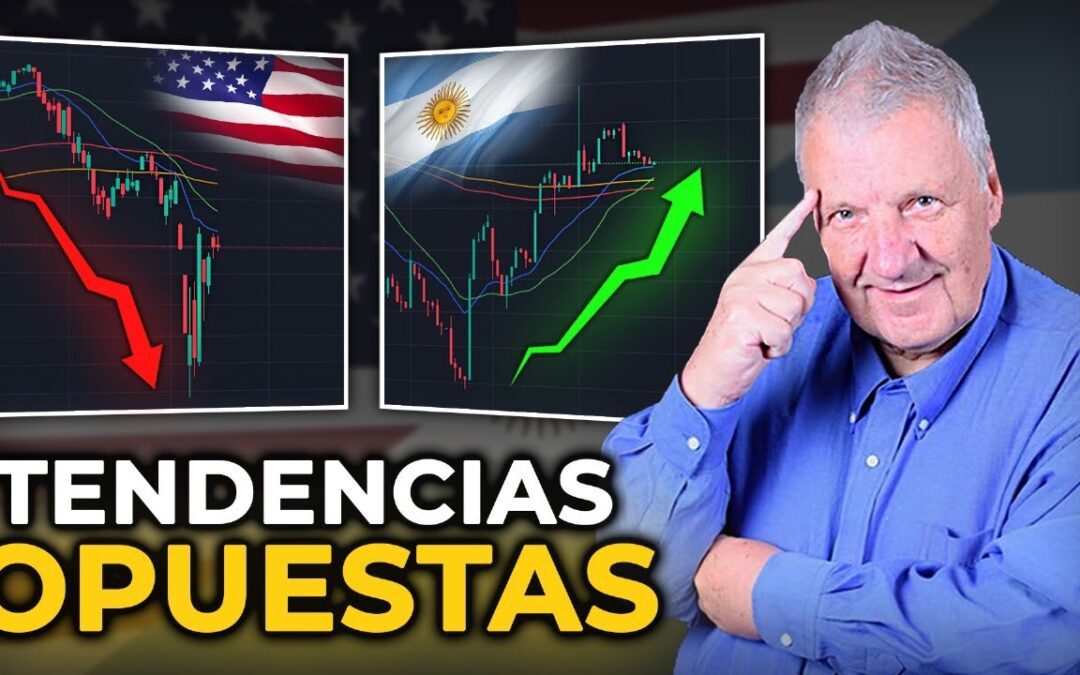
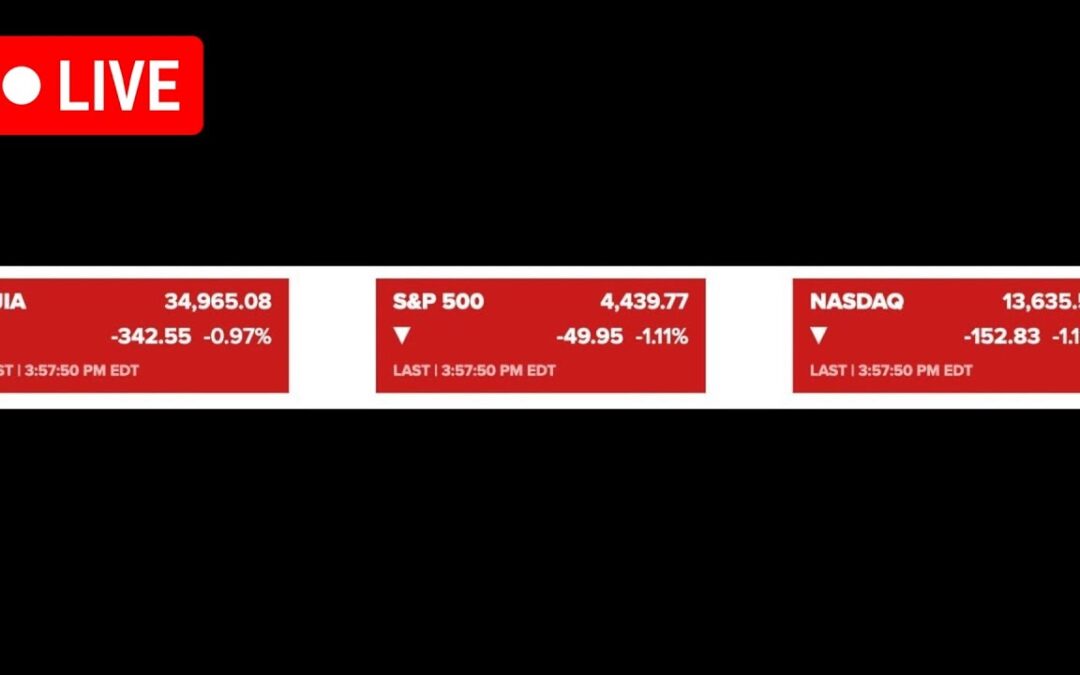
Wall Street Flashes Warning Signs: Bearish Trend Confirmed
📉 The Dow Jones (DA) shows a confirmed double top pattern, followed by a pullback to the structure before resuming its fall, indicating a bearish reversal.
⚠️ Similar bearish patterns (double tops, pullbacks, weakness) are observed in the S&P 500 (PIS) and Nasdaq, reinforcing the negative outlook for the broader US market.
📉 The Relative Strength Index (RSI) for major US indices failed to surpass the 50 level during rebounds, signaling a lack of upward momentum and confirming the downtrend.

Merval Index: Bullish Reversal Signals Major Upside Potential
📈 The Merval index has reversed its downtrend, breaking above key moving averages (200, 21, 42, 100), indicating technical strength.
🇦🇷 Despite a recent sharp correction (43% in pesos and dollars from Jan to mid-April), the index recovered strongly, suggesting the underlying uptrend remains intact.
🚀 A potential "fifth acceleration" or "wave of glory" is projected, building on the significant gains seen since 2021, especially under the "phenomenon Milei".

BYD: The “Chinese Tesla” Set to Benefit from Tariff Wars?
🏆 BYD, Tesla's primary competitor, demonstrates strong fundamentals, surpassing Tesla in revenue with significant growth projections (40-20% quarterly expected), despite a much smaller market capitalization.
📈 The stock shows exceptional relative strength (RS Rating 98), hitting new highs while the market struggles, indicating strong buying pressure and potential for trend continuation after a long consolidation period.
🌍 BYD may actually benefit from tariff wars, as its strategic focus on China, Europe, and Latin America (avoiding the US market) could give it a competitive edge over US manufacturers facing tariffs abroad.

Grindr Defies Market Weakness: Poised for Breakout?
📈 Grindr (GRND) exhibits significant relative strength, holding near all-time highs while the broader market declines, indicating strong institutional accumulation and investor confidence.
🛡️ As a global dating app platform (software) focused on the LGBTQ+ community, Grindr's business model is considered immune to the ongoing tariff disputes affecting physical goods companies.
💰 Despite being a small-cap stock (around $3.8B), Grindr shows consistent revenue growth (over 30% recently) and increasing institutional investment, suggesting potential for significant upside upon breaking resistance levels.

HIMS Hits Key Support: Buy the Dip in This Growth Stock?
📉 HIMS stock has fallen significantly but is now testing a crucial long-term support level (40-week/200-day moving average), potentially offering an attractive entry point for investors monitoring technical levels.
💰 HIMS boasts impressive fundamentals, including strong revenue growth (77-95% recent quarterly growth), expected future profit increases (117% in 2025, 46% in 2026), and increasing institutional ownership, signaling underlying business strength.
🛡️ As a US-focused online pharmacy platform disrupting the sector, HIMS appears largely insulated from the direct impacts of the current tariff war, reducing a key market risk.

Nvidia Stalls Despite Chip Deal: Divergence Warning?
🤝 Nvidia secured a positive deal related to chip sales, which is fundamentally constructive news.
📉 Despite the good news, the stock's technical chart shows a bearish divergence, similar to the S&P 500, indicating weakening upward momentum.
⏳ Time is passing without the stock making significant upward progress, raising concerns and suggesting caution is warranted for investors.

Argentina’s Merval Index: Poised for More Gains?
🇦🇷 The Merval index experienced significant volatility but closed higher, showing resilience after the removal of currency controls.
📈 Technical analysis suggests the index is likely to continue rising, needing to break the 2.5 million peso level to confirm the uptrend continuation.
💲 The dollar-denominated Merval chart also shows strength, having recovered the 1800 level, with the next resistance seen around 2000.

Bitcoin Nears Resistance: Time to Adjust Stops?
📈 Bitcoin has completed a technical pattern but is now approaching a significant resistance area, warranting caution.
⏳ While there might be room for one more upward push according to the 4-hour chart, a bearish divergence could follow, leading to a potential drop.
🛡️ For those currently in a Bitcoin trade, adjusting stop-loss orders is recommended to protect profits due to the weakened momentum and proximity to resistance.

S&P 500 Hits Resistance: Caution Ahead?
⚠️ The S&P 500 shows a technical divergence, indicating potential weakening momentum despite recent price action.
📉 A key resistance level is identified around 5600; failure to decisively break above this zone soon could signal a pullback.
⏳ The 'Dead Cross' indicator (50-day MA crossing below 200-day MA) is discussed, though noted as a lagging indicator that often confirms a decline already in progress.
